

More Citations, Fewer Violations: What Added Enforcement Did in Indianapolis
Rethink the value of parking enforcement by exploring how better compliance can reduce congestion, improve safety, and prevent wider economic costs.

Quantifying the safety and congestion impact of ParkIndy's enforcement optimization
When a city writes more parking tickets, the usual reaction is suspicion. Rather than view enforcement as an effort to reduce congestion or promote safety, critics often assume ticket issuance is simply a revenue play. Without data quantifying reduced emissions, fewer collisions, or shorter travel times, that revenue narrative can dominate the conversation.
In late 2024, Indianapolis set out to optimize parking enforcement by better allocating its personnel. We examined data from January 2023 through September 2026 to determine how those changes affected parking behavior and whether the benefits extended beyond increased citation issuance.
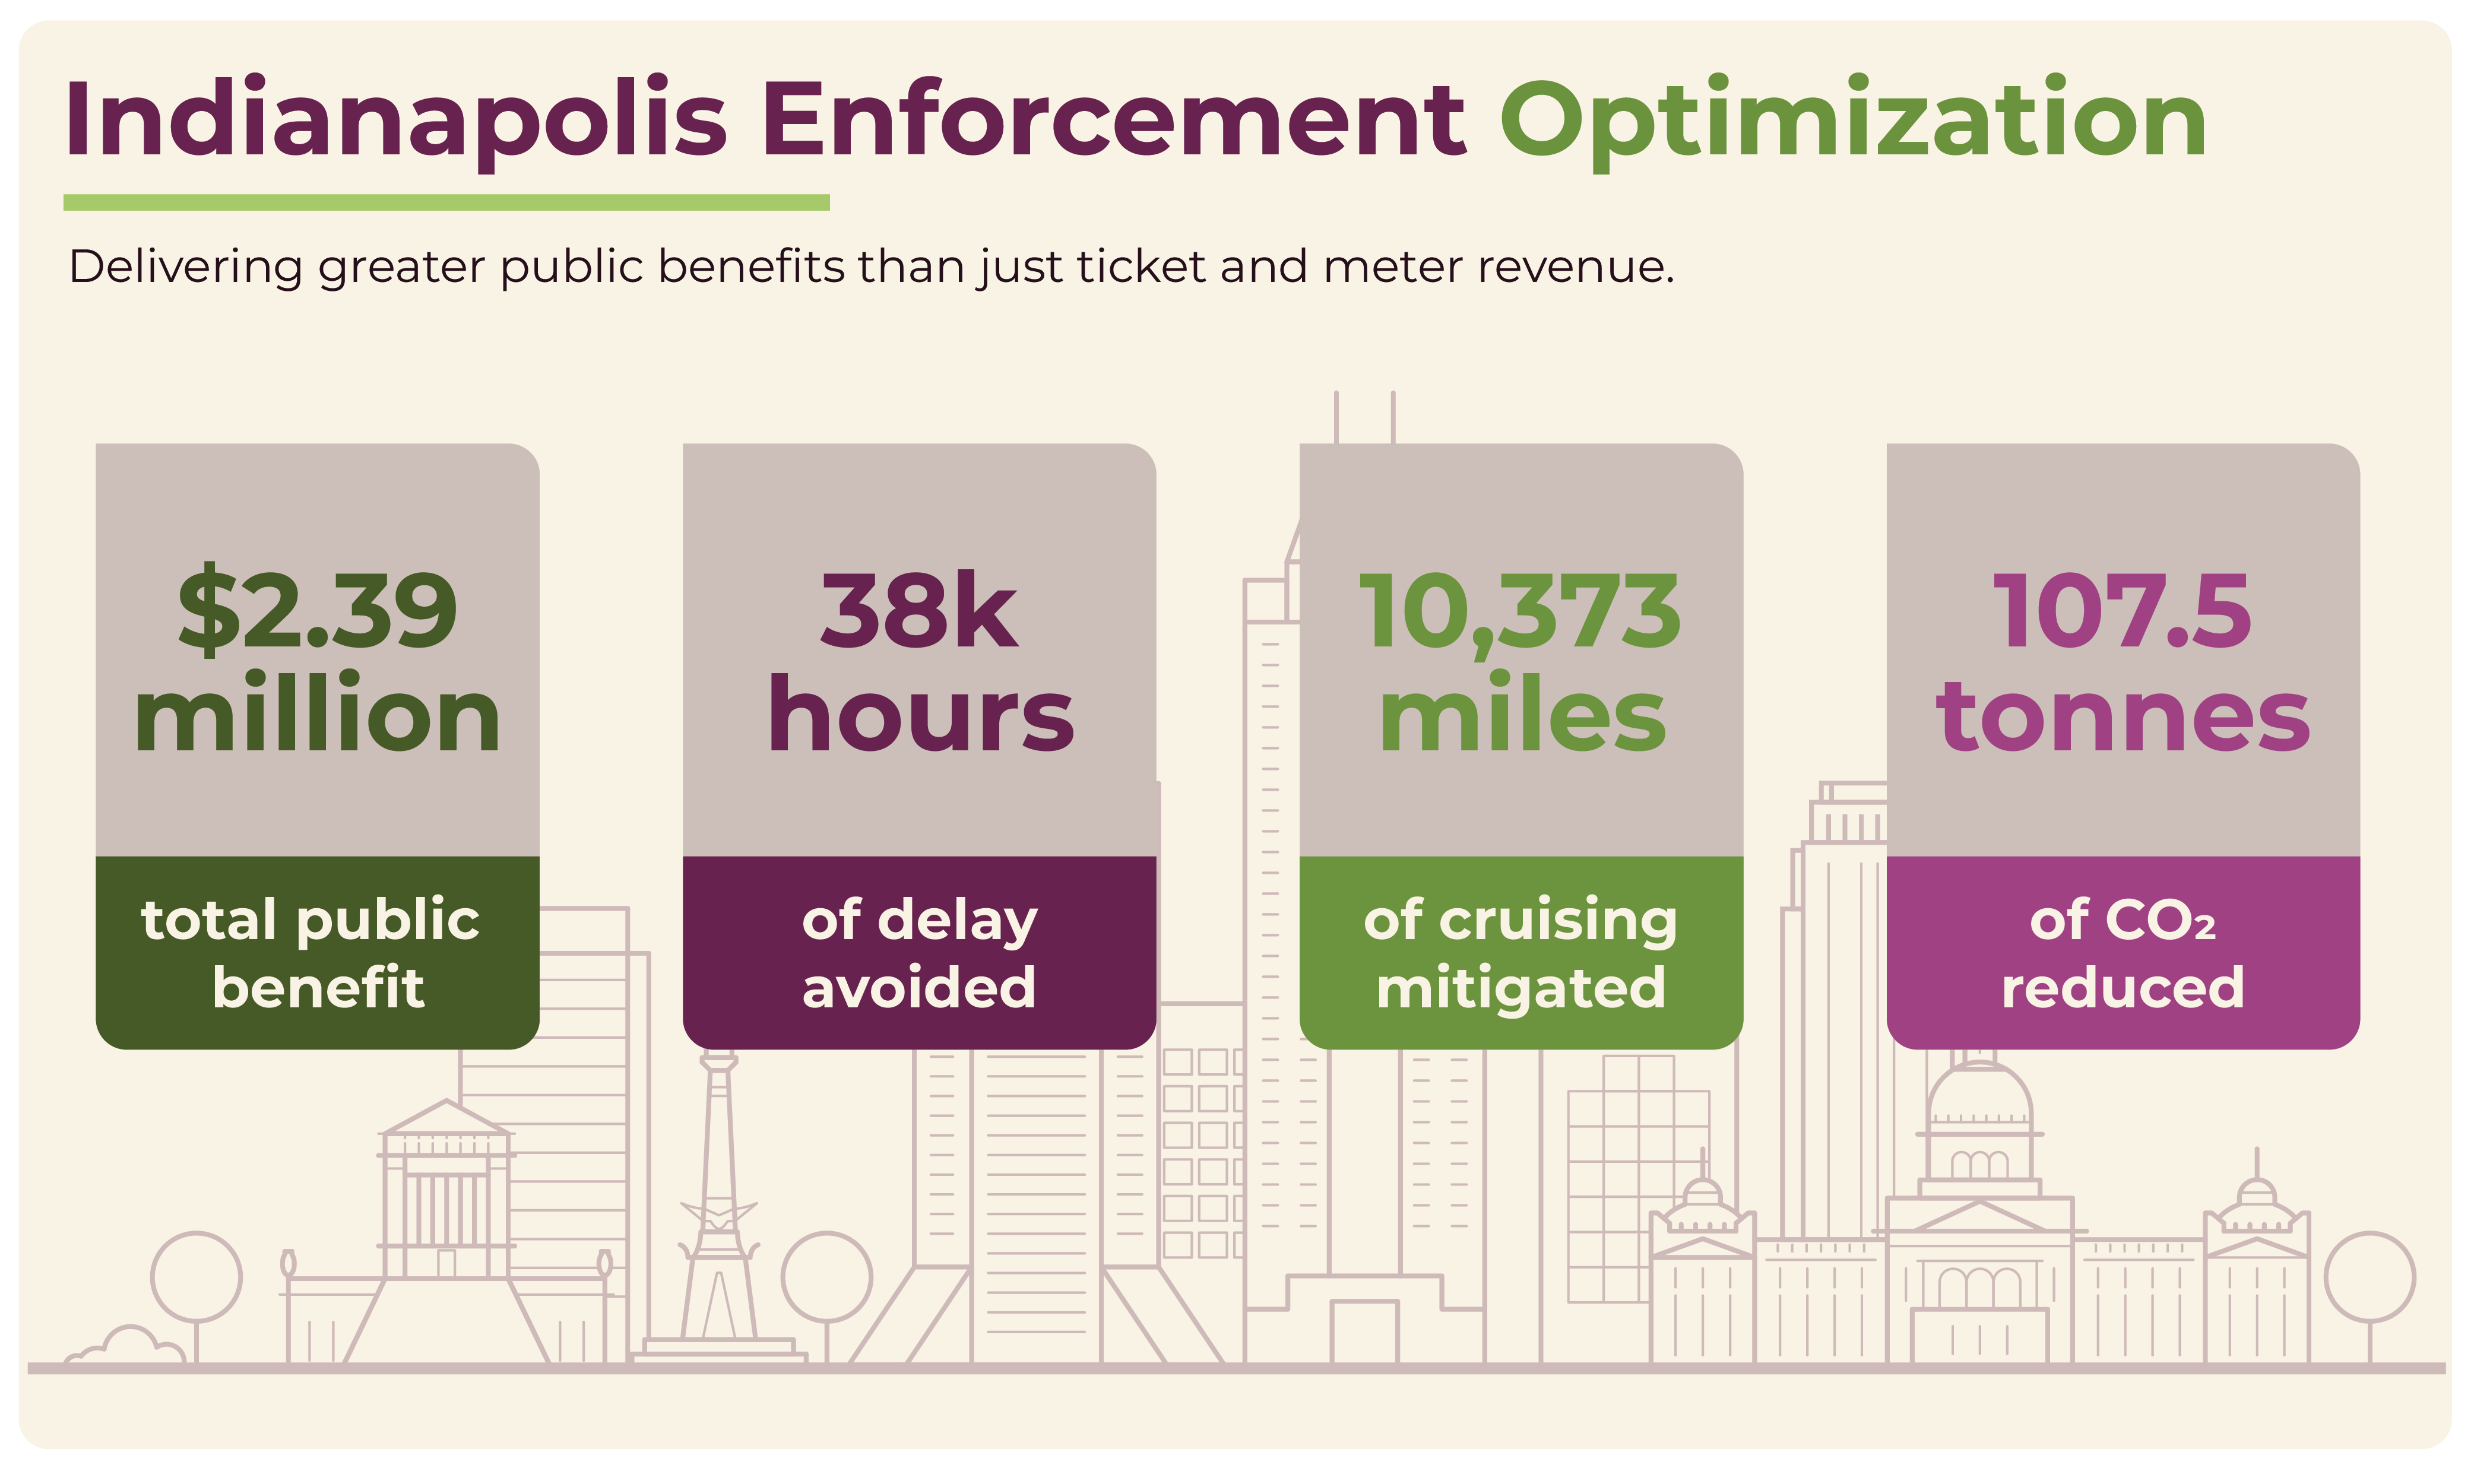
Indianapolis recognized an opportunity to improve enforcement by adjusting officer schedules and deployment zones to better align with the likelihood and consequences of parking violations.
Deployment recommendations were informed by several data sources, including meter utilization, historical citation issuance, 911 and 311 complaints, and pedestrian and cyclist collision data.
Importantly, we deliberately deemphasized historical citation issuance to avoid creating a self-fulfilling cycle in which officers were repeatedly sent to locations simply because those locations had produced citations in the past.
Instead, greater weight was placed on collision data and other indicators of potential public harm. Illegally parked vehicles can contribute to congestion and unsafe conditions in several ways:
By incorporating these considerations into deployment decisions, Indianapolis sought to do more than increase the number of citations written. The objective was to improve the certainty of enforcement where illegal parking posed the greatest risks to safety and mobility.
The operational changes produced a substantial increase in enforcement activity without a corresponding increase in staffing.
In 2025, compared with 2024:
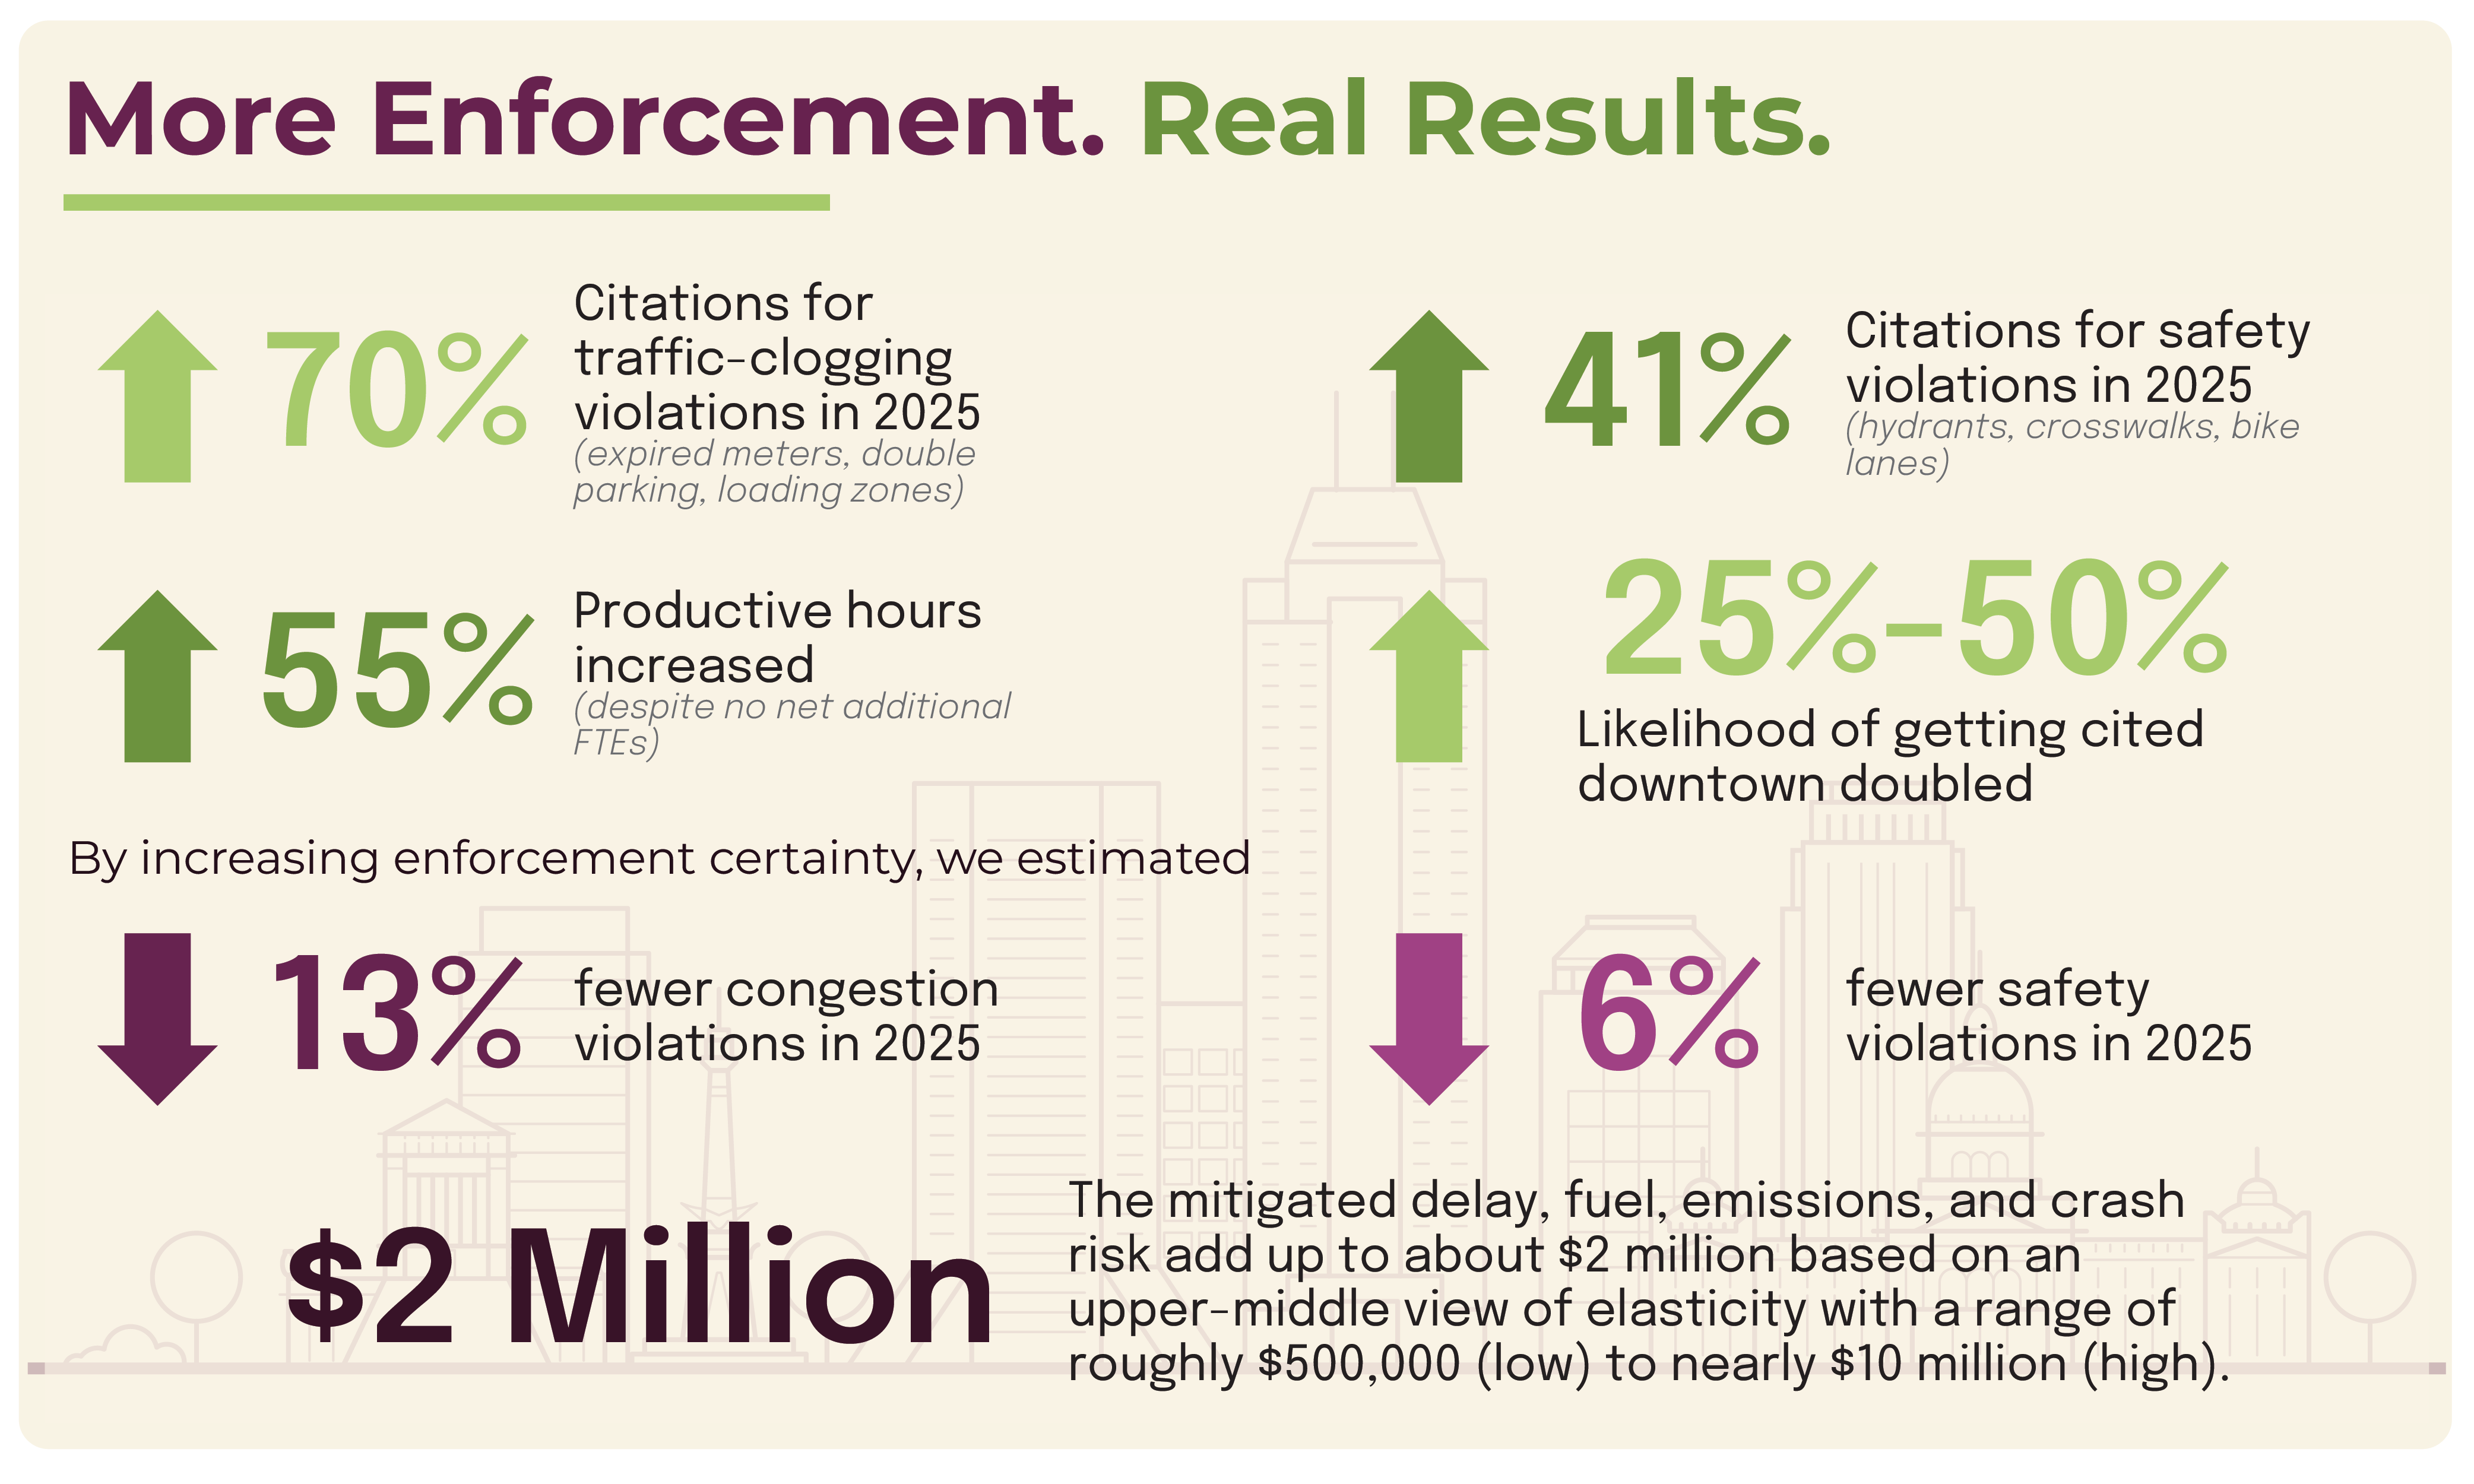
These results indicate more hours with citation activity, but not necessarily more total patrol hours or higher citations per hour. They also raise an important question: if congestion-related citations increased approximately 70%, did illegal parking increase by the same amount?
Not necessarily.
A citation is evidence that a violation was detected. It is not a measure of all violations that occurred. An officer might observe one illegally parked vehicle on a block while several others go undetected because the officer was elsewhere or the violations occurred at different times.
Consequently, an increase in citations can reflect more violations, a greater likelihood of detection, or some combination of the two. To understand whether Indianapolis was improving compliance, we needed to look beyond citation totals.
One of the clearest opportunities to observe behavioral change comes from parking meter payments.
A driver deciding whether to pay a meter is making an economic calculation, consciously or otherwise. The decision depends partly on the meter rate, the fine for nonpayment, and the perceived likelihood of receiving a citation.
If parking costs $2 per hour and the fine is $20, a driver who believes the chance of being cited is less than 10% may conclude that avoiding payment is economically advantageous.
The certainty of enforcement matters. We examined citation activity by metered block, day, and hour to estimate how frequently enforcement created a financial incentive to pay. The results were notable.
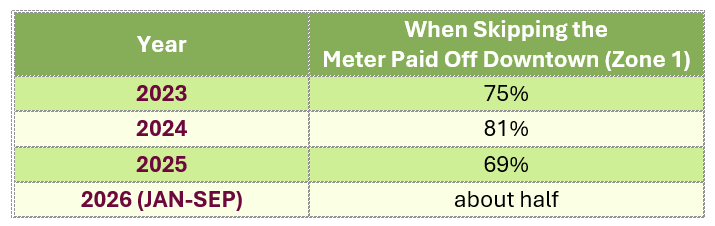
As enforcement increased, avoiding meter payment became a less attractive gamble, declining from 81% to a coin-flip.
This occurred even though Indianapolis increased some hourly meter rates in February 2025 while maintaining the $20 expired-meter fine. Higher meter rates, all else equal, would have made nonpayment more financially attractive.
We also examined whether increased enforcement activity was associated with subsequent paid parking utilization. Across 220 metered blocks and 41 months of comparable observations (8,518 block-months), one additional meter citation per 100 metered space-hours in the preceding three months was associated with approximately 8.4% higher paid utilization. Blocks experiencing greater enforcement subsequently experienced higher paid meter use. Enforcement drove approximately 301,000 additional paid hours in 2025 compared to 2024.
The more difficult question is whether increased enforcement reduced the underlying number of violations. Unlike citations, violations that go undetected cannot be counted from enforcement records alone. And violations that were prevented through deterrence, by definition, never occurred. We therefore developed a scenario-based model to estimate how changes in enforcement certainty might affect the underlying frequency of illegal parking.
The model begins with a straightforward relationship:
Citations = Violations × Probability of Detection
Suppose a block experiences 1,000 parking violations and officers detect 10% of them. The result is 100 citations.
If officers increase their presence and detect 20% of violations, the same number of violations would produce 200 citations.
But if drivers respond to that increased enforcement by parking legally more often, the underlying number of violations may decline.
To estimate how much of the increase reflects greater enforcement rather than more illegal parking, we used a step-by-step approach:
Step 1: Compare equivalent periods
We compared monthly citation activity with the corresponding month in 2024, comparing like calendar months to reduce seasonal differences (not eliminating other changes in parking demand).
We also separated violations by type rather than treating all parking infractions alike.
We used citywide changes by violation type rather than relying on individual blocks, where small citation counts can produce misleading percentage swings.
Step 2: Estimate the response to enforcement certainty
The model uses a concept economists call deterrence elasticity: how strongly the frequency of violations responds to a change in the probability of receiving a citation.
Research on traffic enforcement, fines, automated cameras, and police staffing suggests that individuals respond to changes in the likelihood and consequences of enforcement. However, those studies examine different behaviors and enforcement environments. We tested three assumed behavioral responses informed by related research.
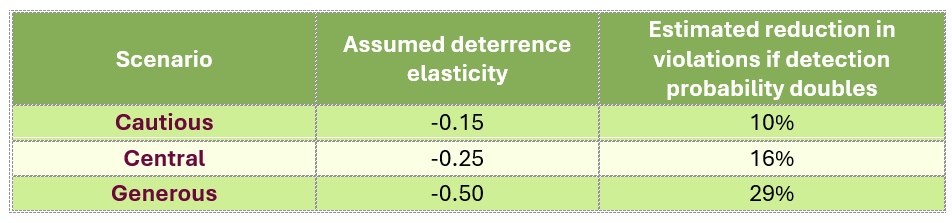
The central elasticity (−0.25) falls within the range of some studies of fine changes and is stronger than several estimates from police-staffing research. Automated red-light camera findings inform the generous scenario but are not directly comparable to parking enforcement.
To verify this, we also compared these assumptions with ParkIndy’s operating data. From 2024 to 2025, enforcement presence, measured as “recorded officer presence,” on metered blocks rose from 2.9% to 5.4% of block-hours, an increase of approximately 86%. Over the same period, expired-meter citations rose about 73%.
If the number of underlying violations had remained unchanged, and detection probability had increased in proportion to recorded officer presence, citations would have risen by roughly the same 86%. The smaller increase is consistent with some drivers responding to greater enforcement certainty by paying their meters. Under those assumptions, the relationship implies an elasticity of approximately −0.12, slightly weaker than the cautious scenario.
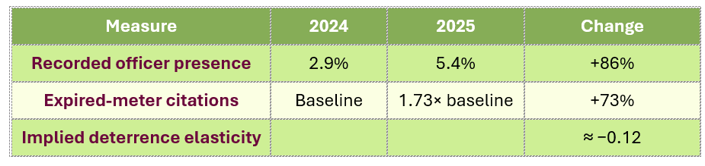
But that analysis is much too conservative. Our measure of officer presence captures only hours in which an officer issued a citation. It excludes patrols during which officers observed no violations, thereby understating the increase in actual enforcement coverage. For example, a slight increase in detection probability of approximately 2.08 times, rather than the recorded 1.86 times (derived from 5.4%/2.9%), would be consistent with our previously mentioned central elasticity of −0.25.
This distinction, together with published research on enforcement and driver behavior, supports retaining −0.25 as a reasonable central modeling assumption while testing both weaker and stronger responses.
Having established a range of plausible behavioral responses, we next needed to estimate the proportion of violations that resulted in citations.
Step 3: Estimate the share of violations detected
The model also requires an estimate of how frequently violations result in citations.
Data show that officers issued citations during approximately 3% to 6% of metered block-hours. However, this measure excludes patrol activity that did not result in a citation. Actual officer presence was therefore higher than the recorded percentage, although the available data do not establish how much higher. This limitation is important when estimating detection probability: recorded citation-writing activity provides a floor as it does not capture every opportunity for enforcement. Our assumed 10% detection rate for expired-meter violations reflects that distinction and is supported by published parking research provides an additional point of comparison.[i]
The detection rate affects the estimated number of underlying violations and the number prevented. The behavioral-response assumption determines the modeled percentage reduction associated with a change in enforcement.
Step 4: Calculate the implied change in violations
Using observed citation changes and the assumed behavioral response, the model estimates detection probability and underlying violations implied by those assumptions and the observed citation totals.
Under the central elasticity scenario, the results suggest that Indianapolis experienced approximately:
Those reductions correspond to approximately 100,000 congestion-related violations and 1,200 safety-related violations potentially prevented in 2025.
A downtown block on East Washington Street illustrates how the methodology works in practice.
Between September 2024 and September 2026, citations classified as double-parking and other obstructive infractions increased from 40 to 139. Over the same period, productive officer-hours on the block increased from 61 to 191.
Despite the greater enforcement activity, citations per productive officer-hour across all violation types declined slightly from approximately 2.3 to 1.9.
That pattern is consistent with increased enforcement coverage and potentially improved compliance, although it does not independently establish that violations declined.
Applying the model's central assumptions produces the following estimates:
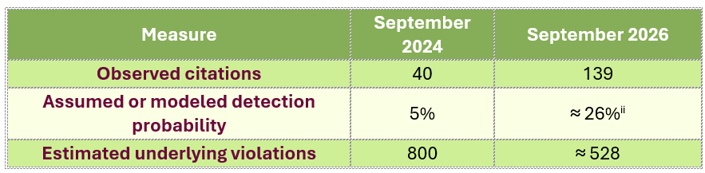
Under these assumptions, the model implies approximately 272 fewer underlying violations in September 2026 than in September 2024 (800 versus 528), a 34% modeled reduction. This is a comparison of estimated counts, not a directly observed count of prevented violations.
The example illustrates why a substantial increase in citations does not necessarily indicate a corresponding increase in illegal parking. It also demonstrates why citation totals alone are an incomplete measure of enforcement effectiveness.
Preventing a parking violation can create societal benefits:
To estimate these broader consequences, we combined modeled reductions in violations with parking utilization data and economic values drawn from the U.S. Department of Transportation's (USDOT) benefit-cost analysis guidance.
For congestion-related violations, the model considers travel delays, additional vehicle operating costs, and emissions. For safety-related violations, it considers potential changes in crash risk and certain accessibility impacts.
Using USDOT’s economic values alongside assumed incident impacts and modeled violations prevented, the model estimates the following public benefits. The USDOT provides valuation guidance; it does not validate the assumed number of incidents or their attribution to parking enforcement:

The cumulative estimate using the central elasticity model from 2024 through September 2026 is approximately $1.99 million.
Because the estimates depend on assumptions about detection, deterrence, and the consequences of violations, we also calculated cautious and generous scenarios. The cumulative range extends from approximately $503,000 to $9.84 million.
Not every parking violation has the same consequences.
In 2025, expired-meter violations accounted for approximately 95% of congestion-related citations in Indianapolis. Yet most of the congestion benefits estimated by our model came from preventing double parking, blocked loading zones, and other violations that directly interfere with traffic.
But meter violations can also have consequences beyond unpaid parking fees.
Consider a busy commercial block. Even if only 70% of its parking spaces are occupied, the spaces closest to a restaurant, loading dock, or delivery destination may be completely full. When drivers cannot find suitable parking near their destination, they may double park, block a bicycle lane, or stop in a restricted area.
By examining 43 months of parking activity in Indianapolis, we found that blocking citations per recorded officer-hour were approximately 30% higher when the busiest stretch of curb was full, compared with periods when that area was busy but not full. This association doesn't prove that unavailable parking caused those violations, but it suggests that maintaining access to busy curb spaces can have benefits beyond parking compliance.
What might those additional benefits be worth?
We modeled three hypothetical scenarios based on the share of drivers unable to find suitable curb space who might otherwise stop illegally and obstruct traffic.
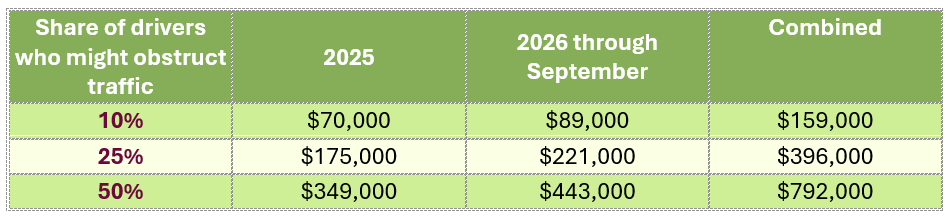
These are illustrative estimates, not measured Indianapolis outcomes. They represent potential avoided congestion costs and are not included in the model's principal public-benefit totals.
Under the middle scenario, that represents approximately 5,160 potential obstructive parking incidents avoided between January 2025 and September 2026, with an estimated public benefit of $396,000. These values would be in addition to the modeled public benefits of $1.99M noted above.
The lesson is that effective parking enforcement isn't simply about writing more citations. It's about maintaining access to the curb and preventing the violations that create the greatest problems for everyone using the street.
Indianapolis recorded 17 fewer serious and fatal pedestrian and cyclist injuries in 2025 than in 2024, declining from 128 to 111. While encouraging, we cannot attribute that improvement to parking enforcement alone.
Our model takes a conservative approach. It assumes that 12% of these injuries occur on blocks where parking is enforced, and that illegal parking contributes to 5% of those incidents. After accounting for the estimated improvement in compliance, the model attributes only about 0.06 avoided serious or fatal injuries to increased enforcement, which is less than 1% of the observed reduction.
The findings offer meaningful evidence that Indianapolis improved enforcement coverage and that increased enforcement activity was associated with changes in parking payment behavior.
They also provide a structured method for estimating the potential deterrent effect and public benefits of those changes.
But some limitations deserve emphasis.
First, the assumed behavioral response is informed by published studies of related enforcement contexts and checked against ParkIndy officer-activity and payment data. The two local checks imply the central model makes sense despite not being directly measured.
Second, the estimated share of violations detected is based on informed assumptions rather than direct field observations. Citation-writing presence omits patrols without tickets, and paid-meter occupancy does not reveal all unpaid occupancy. The estimates also depend on how parking demand and meter rates changed over time.
Finally, the estimates assume that behavioral responses continue as enforcement increases. That assumption becomes particularly important when interpreting the larger 2026 results.
The Indianapolis experience illustrates why cities should evaluate parking enforcement through more than citation totals and fine revenue. Citation productivity tells us how enforcement resources are being used. Compliance tells us whether driver behavior is changing. And public value tells us whether those changes are producing meaningful benefits for the community.
ParkIndy’s observed enforcement and payment records are consistent with improved compliance, while modeling suggests substantial reductions in violations and avoided public costs. The new localized curb-occupancy analysis adds evidence that full stretches of curb are associated with more obstructive parking, a potential benefit not separately valued in the principal totals.
The precise magnitude of those benefits remains uncertain. But the analysis provides a foundation for measuring outcomes that traditional enforcement reports often overlook. It also reinforces an important operational principle: The objective should not be to maximize citations. It should be to maximize compliance and reduce the public harm associated with illegal parking.
Achieving that objective requires thoughtful deployment, reliable data, appropriate enforcement priorities, timely notification, adequate fine severity, and consistent follow-through. When those elements work together, parking enforcement becomes more than a citation-producing function. It becomes a tool for managing limited curb space, improving mobility, and protecting the people who use public streets.
At Trellint, we help municipalities use data, analytics, and operational expertise to improve enforcement effectiveness and measure the public value of their programs. To learn more, visit www.trellint.com.
[i] Romain Petiot (2004), “Parking Enforcement and Travel Demand Management,” published in Transport Policy, Volume 11, Issue 4, pages 399–411.

At the assumed 5% detection rate, the estimated number of violations in September 2024 is:

Next, the model assumes that violations respond to changes in detection probability according to:

Where  represents violations and
 represents detection probability.
Combining this relationship with the observed increase from 40 to 139 citations gives:


Therefore:

And the corresponding estimated violations are:

Read the newest updates and insights from our team.
Rethink the value of parking enforcement by exploring how better compliance can reduce congestion, improve safety, and prevent wider economic costs.

Rethink the value of parking enforcement by exploring how better compliance can reduce congestion, improve safety, and prevent wider economic costs.

As parking technology matures, feature lists matter less than architecture. Here's what agencies should really evaluate when choosing their next platform.

As AI adoption grows across the parking industry, Gaurav Khanna from Trellint explores why success depends on building an AI-ready organization.

Discover key takeaways from Trellint's IPMI Virtual Learning Lab, where David Strathy-Miller and Sean Mackin discuss open ecosystems, modernization, and future-ready parking technology.
Evaluate parking citation collections bids with confidence. A practical guide to RFP requirements, vendor accountability, performance oversight, and revenue recovery.
Have a question or request? Let us know and we’ll follow up shortly.